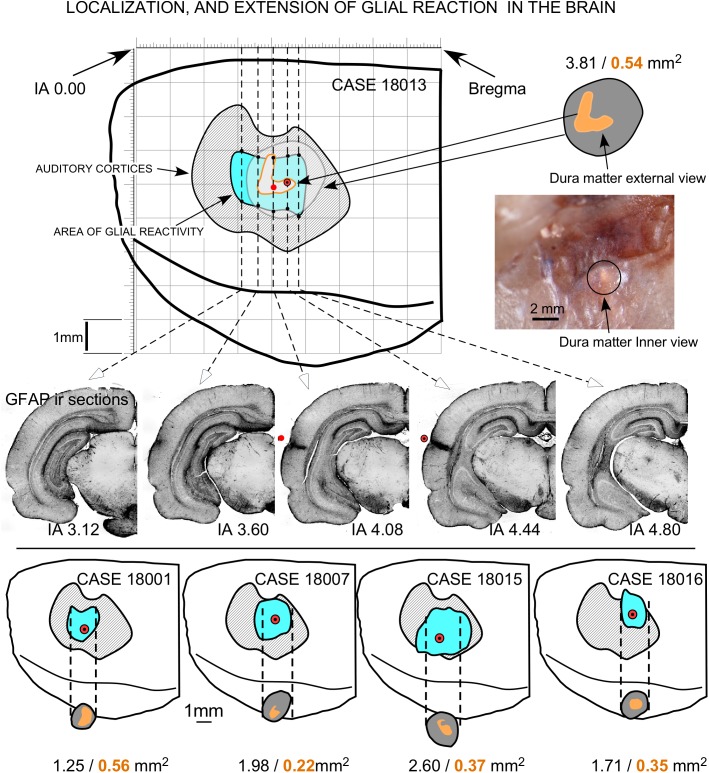
FIGURE 9.
Topographical reconstruction of active GFAP immunoreactivity zones (AZ) of the brain surface, with respect to the cytoarchitectural limits of the ACs (dashed areas in gray), after multisession stimulation. The surface of the epidural area exposed to the electrode (orange areas) was estimated based on measurements taken after skull transillumination (see Figure 2). The coordinates for representation were obtained from serial sections of five coronal IA levels (middle). Drill surface and dura matter surface values are shown in black and orange letters, respectively.

