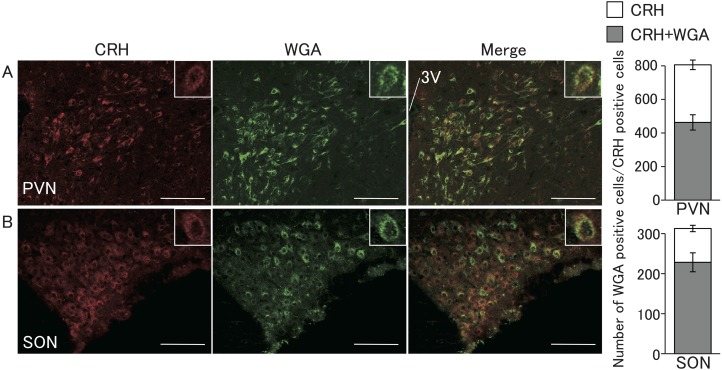
Fig. 6.
Localization of WGA immunoreactivity and corticotropin-releasing hormone (CRH)-immunopositive cells in the PVN and SON. Photomicrographs of sections including the PVN and SON stained by immunohistochemistry for CRH (red) and WGA (green) shown in A and B. Right columns indicate the number of CRH-immunopositive cells with (gray) or without WGA (open). Values are indicated as means ± SEM. Scale bars = 100 μm.

