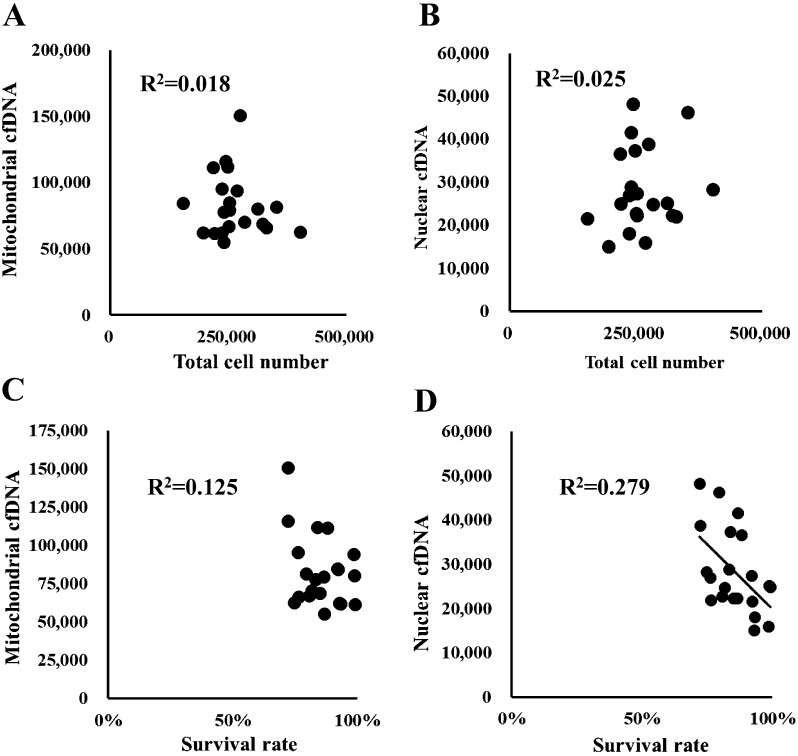
Fig. 2.
Relationship between nuclear and mitochondrial cell-free DNA (cfDNA) and the number of total or dead granulosa cells in culture wells. Y-axis: copy number (in 200 μl of medium) of either mitochondrial (A, C) or nuclear cfDNA (B, D); X-axis: number of total granulosa cells (A, B) or survival rate of granulosa cells (C, D). A significant correlation was detected between the dead cell number and amount of nuclear cfDNA in the medium (D, R2 = 0.279, P < 0.05).

