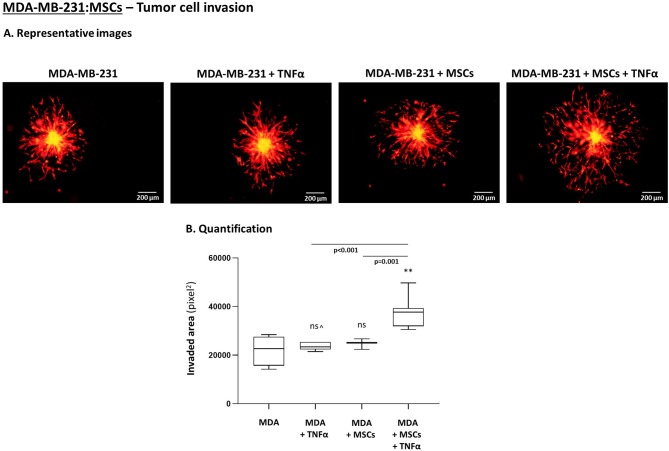
Figure 10.
TNBC cells acquire elevated invasive properties upon “Contact” co-culturing with MSCs in the presence of TNFα. The Figure demonstrates tumor cell invasion out of 3D spheroids that were formed by mCherry-MDA-MB-231 cells (“MDA”) alone or by tumor cells in “Contact” co-culturing with MSCs. The spheroids were imbedded into matrigel and then stimulated by TNFα (10 ng/ml) or vehicle for 48 h. (A) Representative photos. Bar, 200 μm. (B) Invasion was quantified in multiple spheroids by ImageJ. **p < 0.01, ns=non-significant for differences between TNBC cell invaded out of spheroids in different combinations, compared to the invasion of non-stimulated TNBC-only spheroids. ∧See “Note” in legend to Figure 11. Photos and their quantifications are representatives of n > 3 independent experiments, performed with MSCs of 2 different donors.

