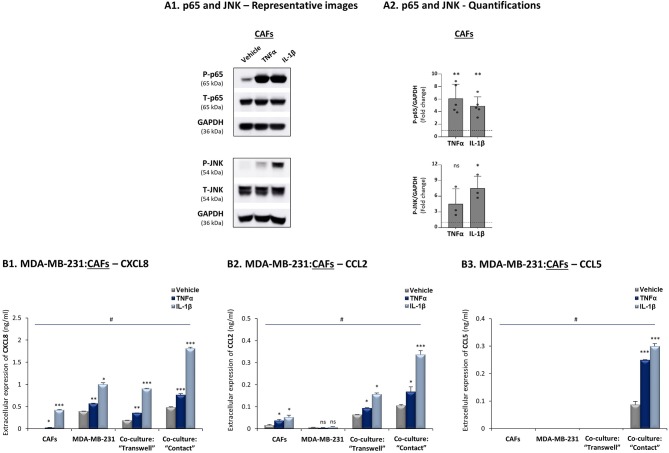
Figure 4.
CXCL8, CCL2 and CCL5 reach their highest expression levels when TNBC:CAF “Contact” co-cultures are stimulated by TNFα and IL-1β. The Figure demonstrates similar experiments and statistical analyses as those of Figure 3, performed herein with MDA-MB-231 cells and CAFs, using similar cytokine concentrations. (A) Activation of p65 and JNK. (B) CXCL8 (B1), CCL2 (B2) and CCL5 (B3) expression levels. In all parts of the Figure, the results are of a representative experiment of n ≥ 3 independent experiments. *, **, ***, # - As described in Figure 3. ns=non-significant.

