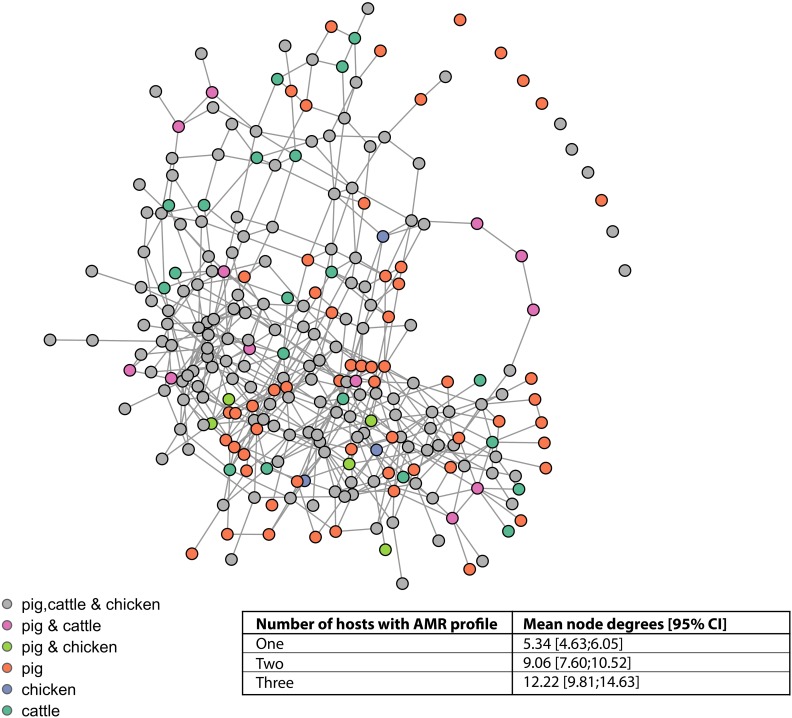
FIGURE 5.
Network connectivity diagram of phenotypic antimicrobial resistance profiles. Nodes represent phenotypic antimicrobial resistance profiles. Edges represent loss or acquisition of resistance to a single antimicrobial. Inset table: mean node degrees and betweenness scores for AMR profiles observed in one, two, or three host species.

