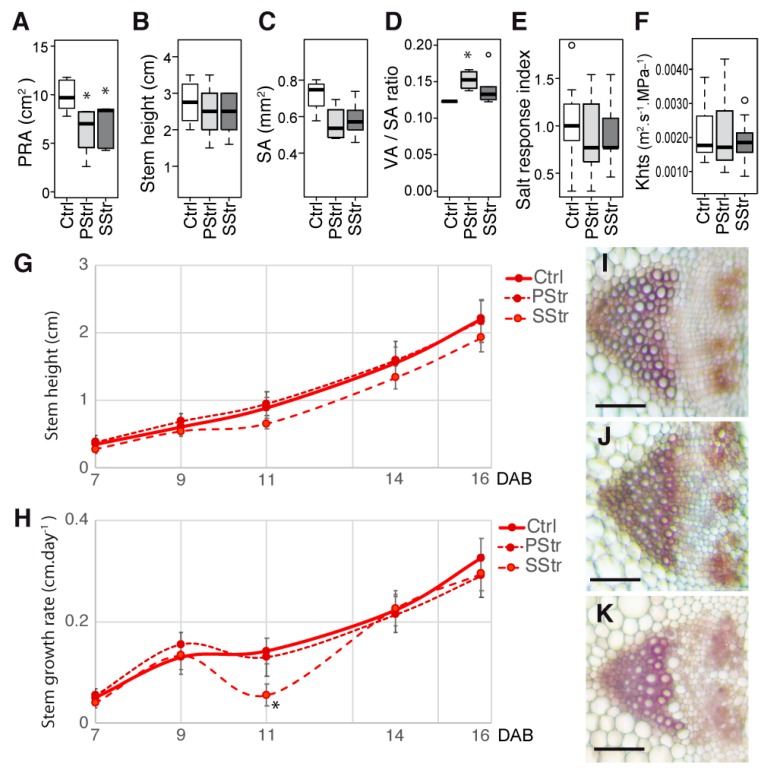
Figure 2.
Responses of Thellungiella salsuginea to high salinity during the reproductive stage. Growth and anatomy of the stem of the control (Ctrl), salt stress (SStr), and pretreatment before stress (PStr) plants. In (A–F), the box and whisker plots show the distribution of the biological replicates. The black lines inside represent the medians; the top and bottom ends of the boxes represent the first and third quartiles, respectively; and the whisker extremities represent the maximum and minimum data points. (A) Projected rosette area at 17 DAB (n = 5–6). (B) Stem height at 17 DAB (n = 5–6). (C) Stem section area (SA) ratio at 17 DAB (n = 4–5). (D) Total vascular bundles area per section (VA)/stem section area (SA) ratio at 17 DAB (n = 4–5). (E) Salt response index at 16 DAB (n = 9–12). (F) Stem theoretical hydraulic specific conductivity (Khts) ratio at 17 DAB (n = 3–6). (G,H) Stem height and growth rate from 7 to 16 DAB. The curves represent for each time point the mean ± standard error (SE) (n = 9–12). (I,J,K) Details of the stem vascular bundles of the Ctrl plants (I), PStr plants (J), and SStr plants (K). Bar = 50 µm. Star (*) on the curves indicates a p < 0.05 with a t-test.

