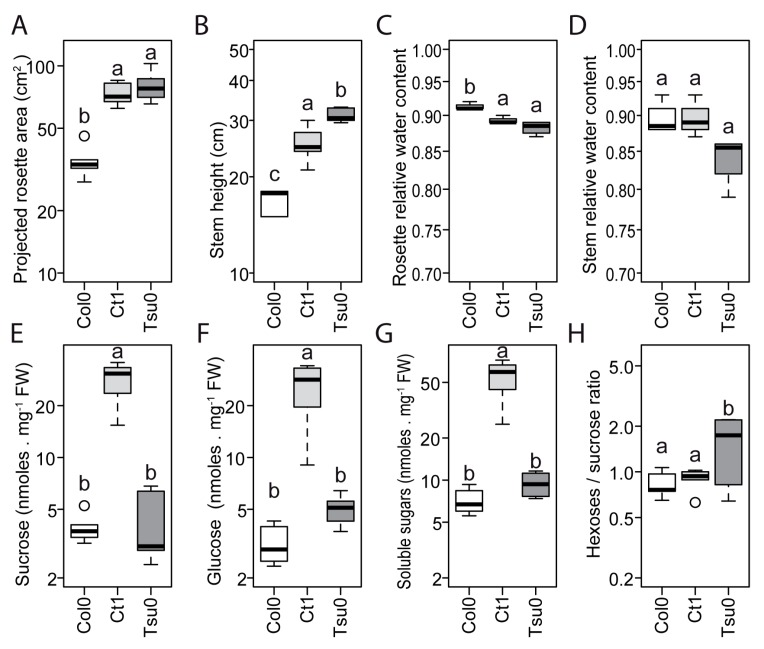
Figure 3.
Natural variation in the size and sugar content of the Ctrl Arabidopsis plants. (A–H) The box and whisker plots represent the distribution of the biological replicates (see Figure 2 for details) with in (A) the projected rosette area (n = 5–6), (B) stem height (n > 9), (C) rosette relative water content (n = 4), (D) stem relative water content (n = 4), (E) sucrose content, (F) glucose content, (G) total soluble sugar content (i.e., sucrose, glucose, and fructose), and (H) and hexoses-to-sucrose ratio ((E–H): n = 5–6). All of the data were obtained at 17 DAB, except for the rosette and stem relative water content that were measured at 16 DAB. Different letters indicate significant differences among the accessions determined using a one-way analysis of variance (ANOVA), combined with a Tukey’s comparison post-test (p < 0.05).

