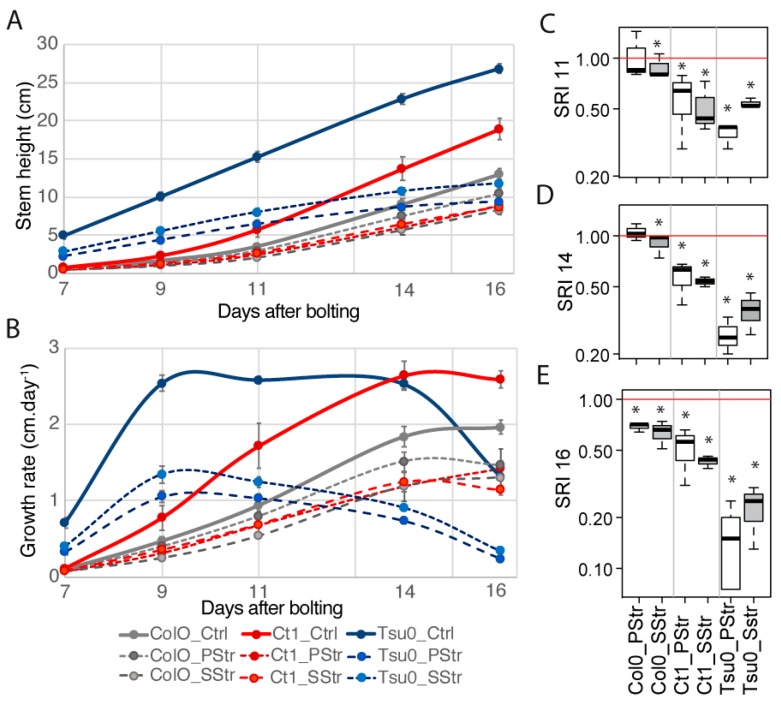
Figure 6.
Stem growth in response to high salinity in Arabidopsis. Growth of the stem for the Ctrl, PStr, and SStr plants. The height of the stem was recorded at 7, 9, 11, 14, and 16 DAB. (A) The height of the stem and (B) the stem daily growth rate. The curves represent the mean ± SE (n = 9–18) for each time point. (C–E) The box and whisker plots represent the distribution of the biological replicates (see Figure 2 for details). (C–E) Salt response index (SRI) of the main stem at 11 (C), 14 (D), and 16 DAB (E). Stars denote significant differences of the treatments compared to the control plants (* p < 0.05, n ≥ 9). In white—PStr plants. In grey—SStr plant.

