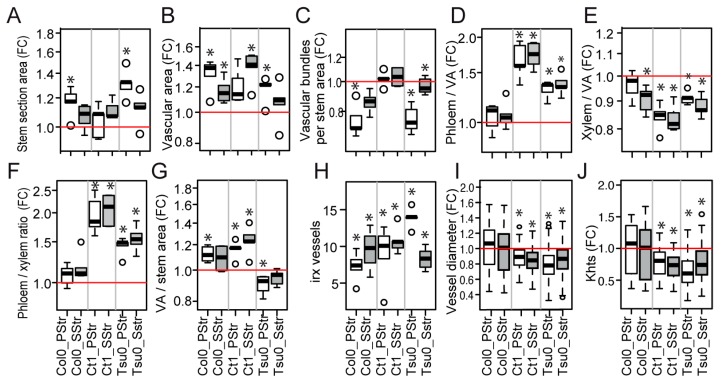
Figure 8.
Natural variation in the Arabidopsis stem anatomy in response to a high salinity at 17 DAB. (A–I) The box and whisker plots represent the distribution of the biological replicates (see Figure 2 for details), within the (A) fold changes in the stem section areas, (B) the fold changes in the total vascular areas per stem section (VA), (C) the fold changes in the number of vascular poles per stem section surface unit, (D) the fold changes in the total phloem area/VA ratio per stem section, (E) the fold changes in the total xylem area/VA ratio per stem section, (G) the fold changes in the phloem area-to-xylem-area ratio, (G) the fold changes in the VA per surface unit of the stem section, (H) the number of irregular xylem (irx) vessels per vascular bundle, (I) the fold changes in the xylem vessel lumen area (J), and the fold changes in theoretical hydraulic specific conductivity. In grey—SStr plants. In white—PStr plants. FC—fold changes. Stars denote significant differences of salt treatment compared to the control condition (* p < 0.05, n = 4–6, except for the irx vessels and Khts values, with n > 36).

