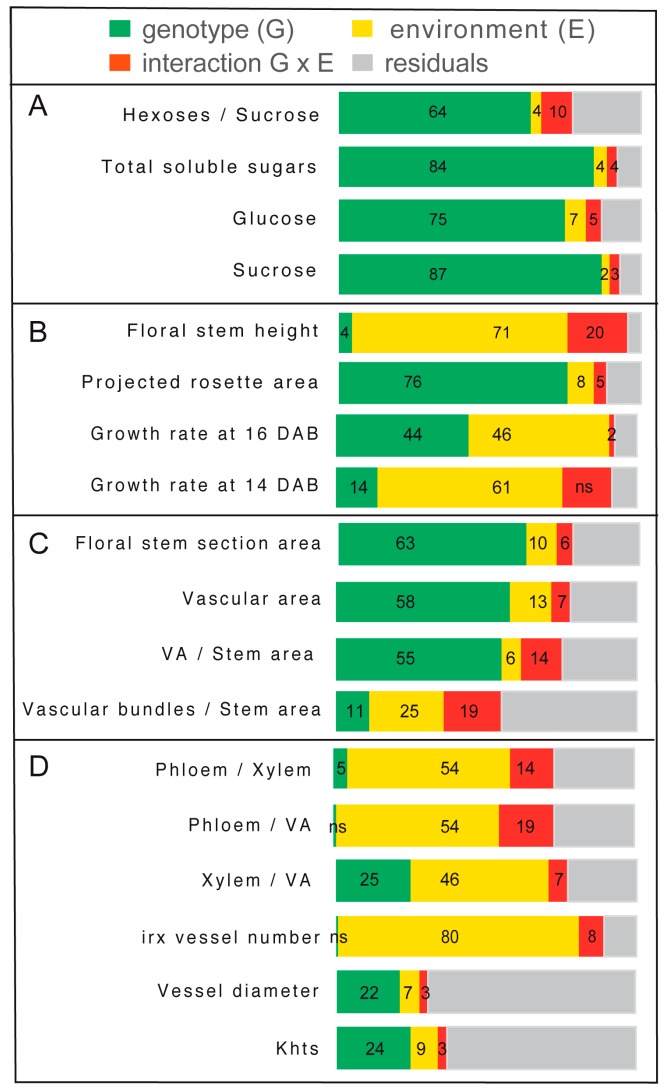
Figure 10.
Analysis of variance of the traits measured during the reproductive stage, showing the effects associated with the genotype (G), the environment (E), and the interaction of genotype x environment (GxE) within the overall variations. VA—total vascular area per stem section. irx—number of irregular xylem cells per xylem section. Khts—theoretical hydraulic specific conductivity. For more details on the data, see the legends of Figure 3, Figure 4 and Figure 6. For each trait, the bars represent the sum of the squares associated with each factor, shown as proportions. The percentages of factors showing significant effects (p < 0.05) are indicated directly in the graph (ns for not significant effects). (A) Traits relative to the stem sugar content. (B) Growth traits of the rosette and stem. (C) Stem anatomic traits. (D) Traits relative to the stem vascular tissues.

