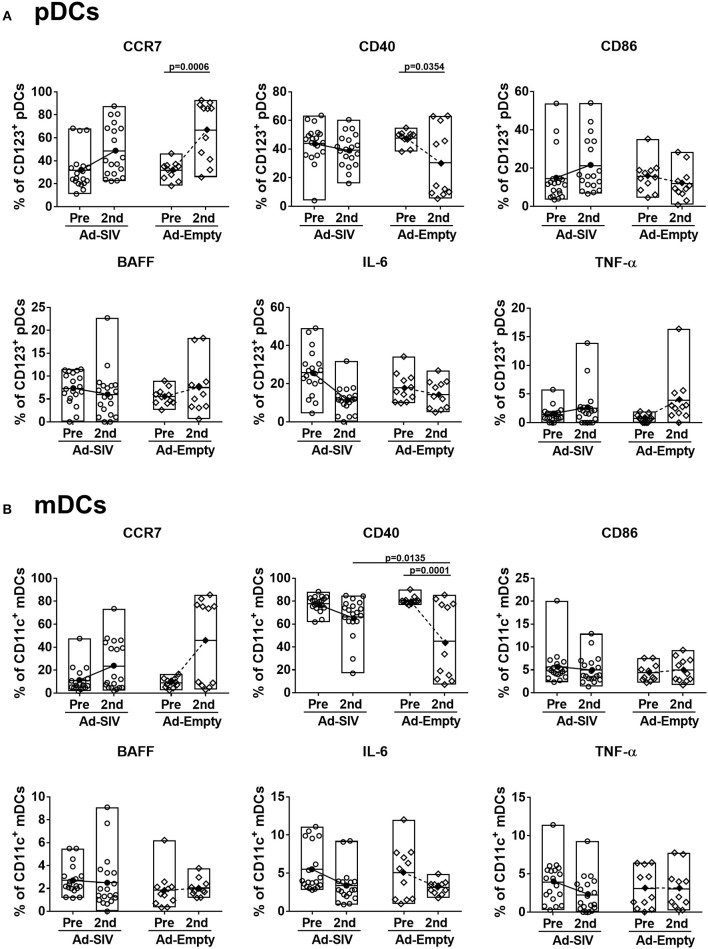
Figure 7.
Migration marker expression is increased in LN DCs. The frequencies of LN pDCs (A) and mDCs (B) expressing migration and activation markers, and cytokines were measured before and at day 14 after the 2nd immunization. The open and filled dots show the individual and mean values, respectively. For statistical analysis, two-way ANOVA and Tukey's post-multiple comparison test were performed.

