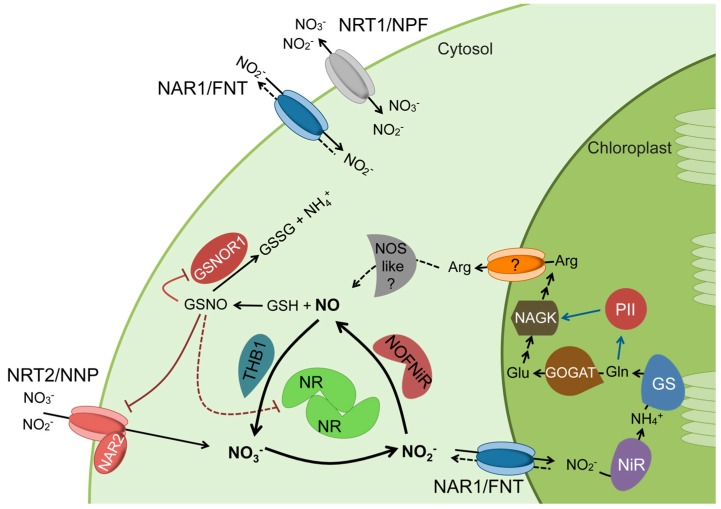
Figure 1.
The schematic model for the coordinated regulation of Nitric Oxide (NO) synthesis and N metabolism. Blue arrows indicate activation and red lines indicate inhibition by trans-nitrosylation. Dashed lines represent hypothetical steps. The NOS-like component represents the L-Arg-dependent NOS activity reported in different plant species.

