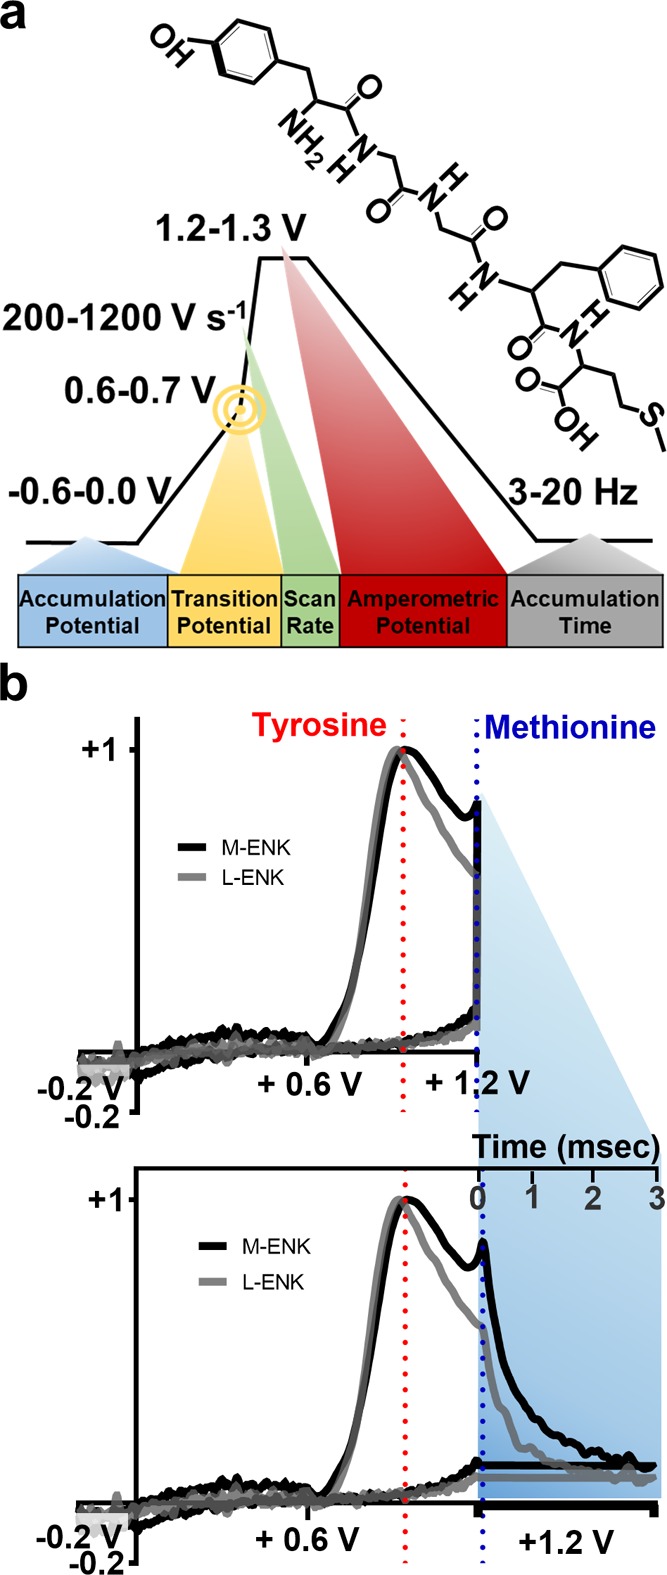
Figure 1.

Introduction to the MSW. (a) A schematic of the MSW with the parameters of interest labeled. M-ENK, the target analyte, was used for waveform characterization. (b) Representative CVs (top) and mCVs (bottom) for M-ENK and L-ENK (normalized). Current collected during the amperometric period is plotted with respect to time (shaded region). M-ENK and L-ENK differ only at the C-terminus, with either a methionine or a leucine group, respectively. Both pentapeptides share the same first peak, but the presence of the second peak allows M-ENK to be visually distinguished.
