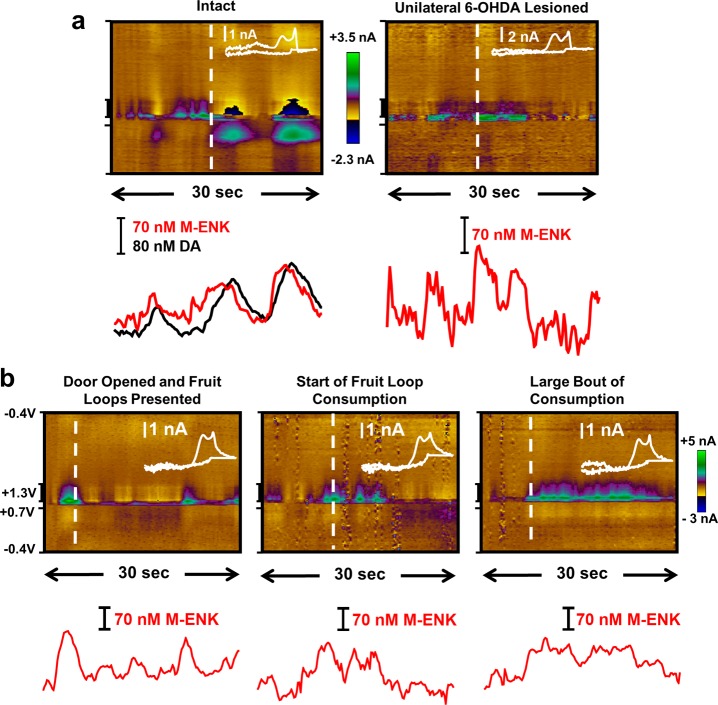
Figure 9.
Neurochemical fluctuations recorded in the dorsomedial striatum of awake, freely behaving rats. Representative color plots are shown, with concentration vs time traces below. Inset mCVs were extracted at the time point indicated by the white dashed lines. (a) Voltammograms that correlate with those collected after infusion of exogenous M-ENK into striatal tissue were evident in the intact striatum (left, R = 0.85), but no CA signal was evident in the 6-OHDA lesioned animal (right). These voltammograms correlate with the M-ENK standard (R = 0.84). (b) A voltammetric signal that correlates with M-ENK fluctuations was recorded in response to the presentation (left) and consumption (middle and right) of unexpected food reward (R = 0.80–0.88).

