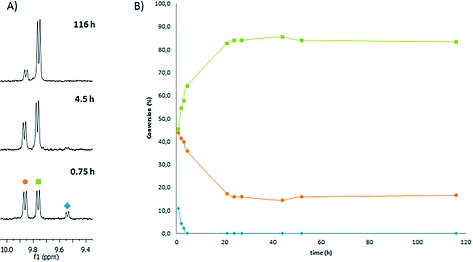
Figure 1.

(A) Evolution of the 1H NMR spectra (300 MHz, D2O) during the coordination of ligand 1 to [Ru(tpy)(bpy)(OH2)](PF6)2 in D2O. (B) The [6]2+:[7]2+ ratio obtained from integration of the A6 proton peaks in the 10.0–9.4 ppm range, plotted vs. reaction time. Conditions: [Ru]0 = 4.2 mm, [1] = 42 mm, T = 353 K, in the dark. Blue diamond = [Ru(tpy)(bpy)(OH2)]2+ (δ = 9.54 ppm), green square = [6]2+(δ = 9.76 ppm), orange circle = [7]2+(δ = 9.86 ppm).
