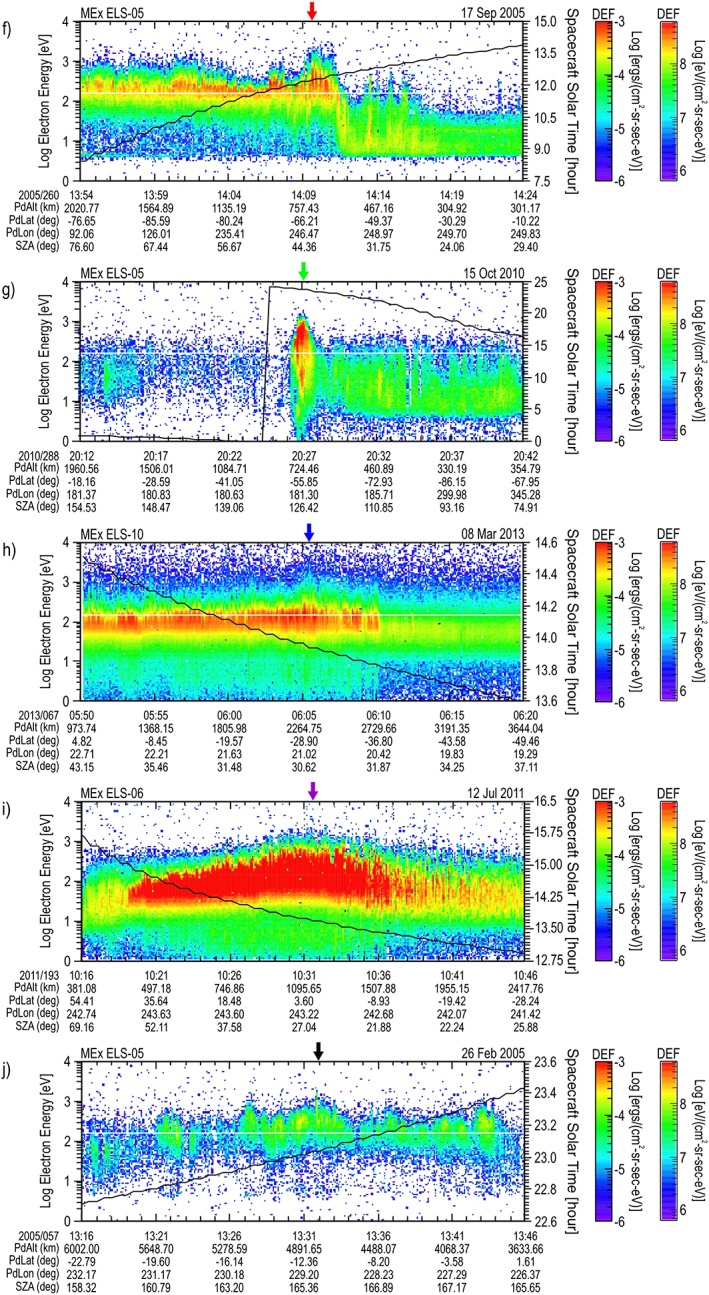
Figure 2.

Second five maximum differential energy flux (DEF) energy‐time spectrograms. The order (f–j) is that listed in Table 1. The overlay and bottom plot label definitions are the same as in Figure 1. An arrow at the top of each panel marks the location of the largest DEF spectrum (the color of this arrow corresponds to the color of the orbit presented in Figure 4 and the maximum DEF spectrum presented in Figure 6).
