
Figure 2.
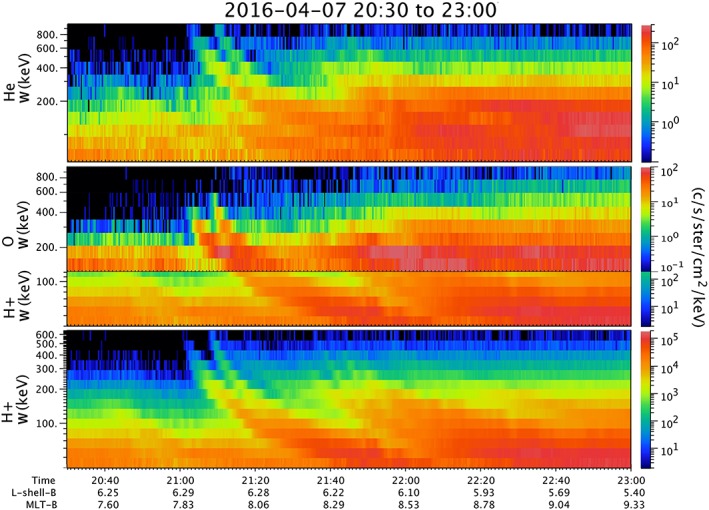
Spectrograms of injection event on 7 April 2016, measured by the RBSPICE B, located at ~0800 LT and L ≈ 6.3. Top panel is He intensity; bottom panel is H. The second (middle) panel is a combined spectrogram of O (higher energies) and H (lower energies). The O measurement does not go below ~140 keV. Because (as we argue in the text) we find the energization and drifts of injected ions to be organized by W/q, the morphology of the lower‐energy hydrogen should mimic the morphology of the O+ in an injection, as demonstrated in this panel.