
Figure 7.
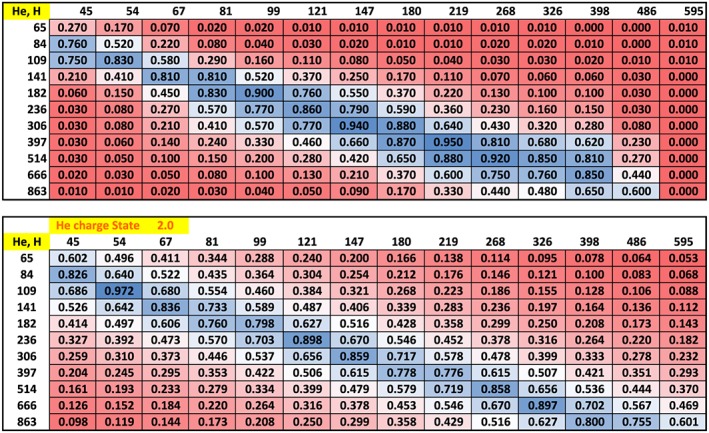
Top: correlation coefficients between time histories of counting rates between H and He, energy by energy. The table is color coded to highlight the consistently high correlation between channels centered on those for which W He ≈ 2 × W H. The lower table is simply a function that maximizes at W He = 2 × WH. The correlation in the data is a bit broader at higher energies than the chosen function in the lower table, but the general trend is consistent.