
Figure 8.
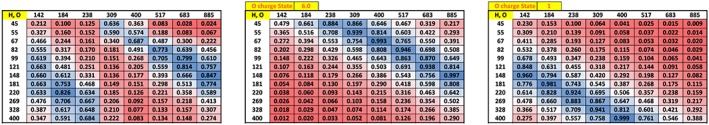
Similar to Figure 7, correlation tables for H and O. Here two regions of high correlation appear. The two model tables (center and right) show predicted regions of correlation for O6+ (center table) and O+ (right). The ion energy time history correlation table shows both patterns, with some minor decorrelation where they would overlap vertically. UT = universal time.