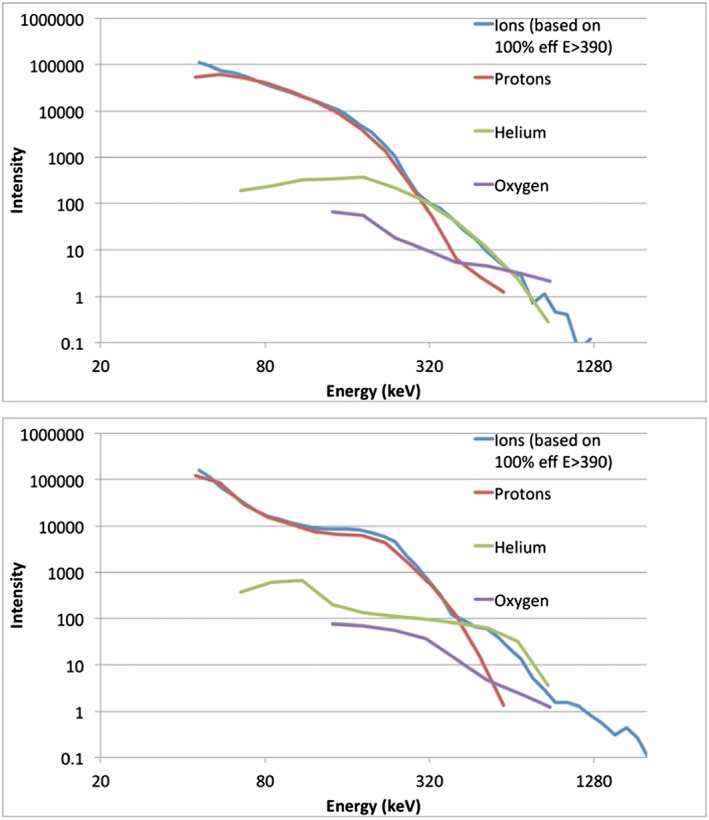
Figure 11.

Intensity spectra taken from a vertical slice through the RBSPICE A spectrograms in Figure 10, at 12:06:12 (first injection) and 12:16:17 UT (the peak intensity in this sequence). The ion spectrum has been adjusted by transitioning to efficiencies consistent with He and O above energies where it is clear hydrogen does not contribute significantly.
