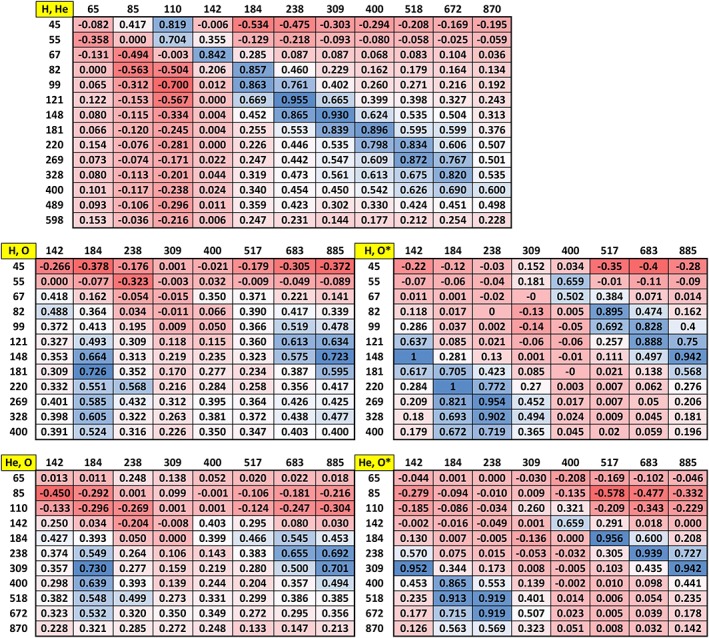
Figure 12.

Similar to Figures 8 and 9, correlation tables for pairs of species. For H versus He, the ridge of high correlation again runs down the W He ≈ 2 × W H region. For the H versus O and He versus O tables on the left, again, two regions of high correlation appear, again, as predicted in the model tables presented in Figure 9. The tables on the right show the correlation coefficients derived from a set of O* energy channels constructed from linear combinations of H and He channels under the same reasoning as given for Figure 9 and in the text.
