
Figure 17.
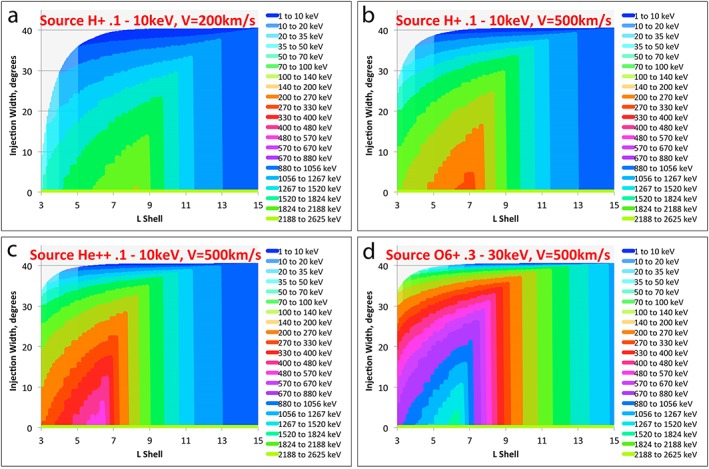
(a) Model results for a source population of 0.1‐ to 10‐keV H+ and a flow velocity in the region beyond 10 R E of 200 km/s; (b) model results for (the same) source population of 0.1‐ to 10‐keV H+ but for a flow velocity in the region beyond 10 R E of 500 km/s; (c) model results for a source population of 0.1‐ to 10‐keV He++, flow velocity in the region beyond 10 R E of 500 km/s; (d) model results for a source population of 0.3‐ to 30‐keV O6+, flow velocity in the region beyond 10 R E of 500 km/s. Note that for an observer at the dusk side of the channel (bottom of plot) at 6 R E and V = 500 km/s, the peak energy for H+ is ~270 keV, the peak energy for He++ is ~540 keV, and the peak energy for O6+ is ~1.6 MeV.