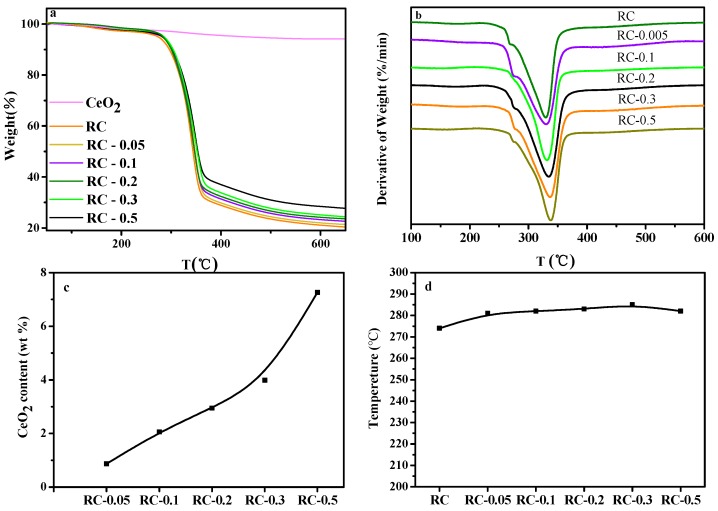
Figure 8.
TGA (a) and DTG (b) curves for RC and RC/CeO2 nanocomposite films under nitrogen atmosphere; (c) the influences of Ce(NO3)3·6H2O concentrations on the content of the incorporated CeO2 NPs (wt%) in the nanocomposite films; (d) the temperature at 5 wt% decomposition of RC and RC/CeO2 nanocomposite films.

