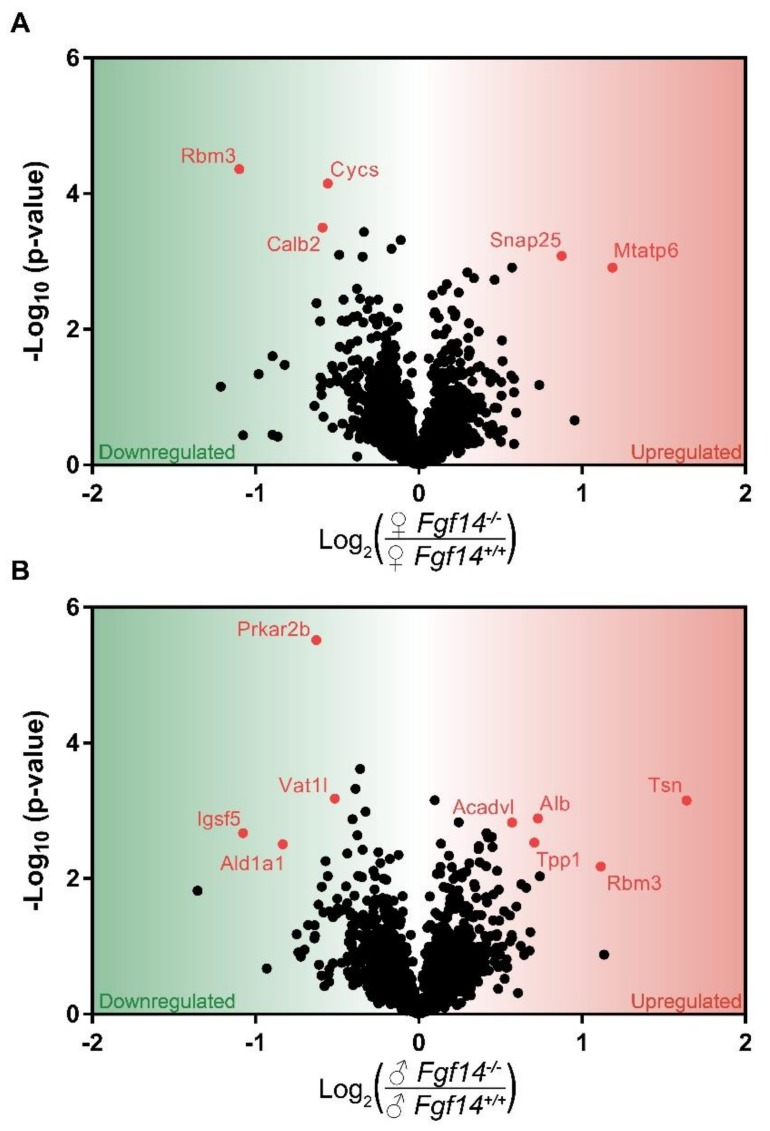
Figure 3.
Volcano plot of mass spectrometry results. Proteins that are significantly upregulated in sex by genotype conditions: (a) shows the proteins significantly upregulated in female Fgf14−/− compared to Fgf14+/+ mice; and (b) shows the proteins significantly upregulated in male Fgf14−/− compared to Fgf14+/+ mice. The Y-axis represents negative log10 (p-value) based on the test statistic, and the X-axis shows proteins with a positive log2 fold change (FC) as upregulated (red), and negative values as downregulated (green) proteins in the Fgf14−/− mice, respectively.

