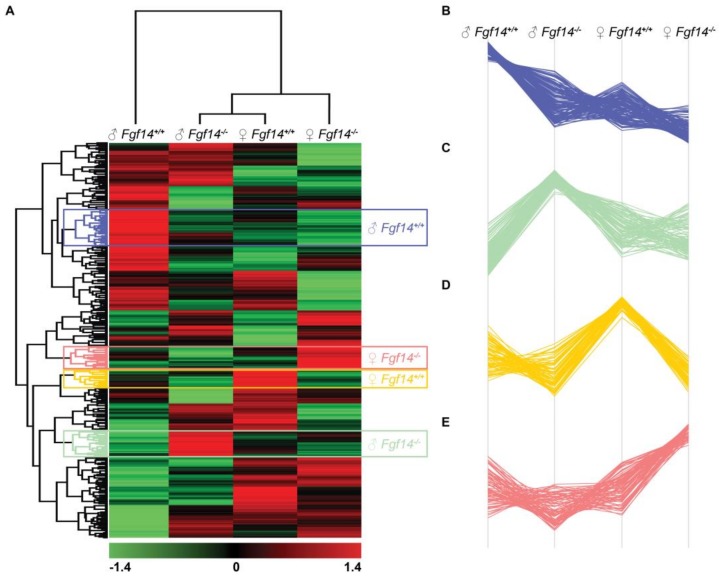
Figure 6.
Hierarchical clustering, heatmap, and cluster analysis of differentially expressed proteins. (A) Heatmap of differentially expressed proteins in male and female Fgf14+/+ and Fgf14−/− mice. LFQ intensities were averaged for technical replicates, and averages across animal groups were Z-scored prior to Euclidean distance-based hierarchical clustering with Perseus (B–E). Protein clusters specific to each animal group, male Fgf14+/+, female Fgf14−/−, female Fgf14+/+, and male Fgf14−/−, respectively.

