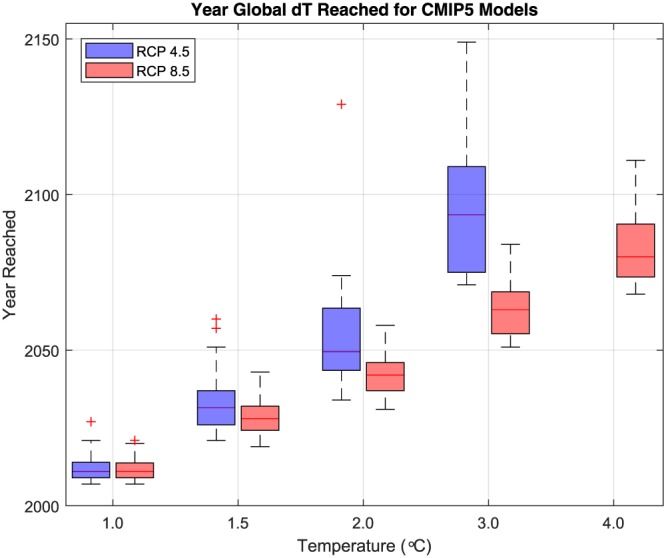
Figure 6.

Year in which warming thresholds of global average surface temperature are met under different emissions trajectories. The horizontal lines within each box show the median time to reach each threshold across all available models, the boxes show the interquartile range based on all models, and the whiskers extend from the 5th–95th percentiles. CMIP5 = Coupled Model Intercomparison Project Phase 5.
