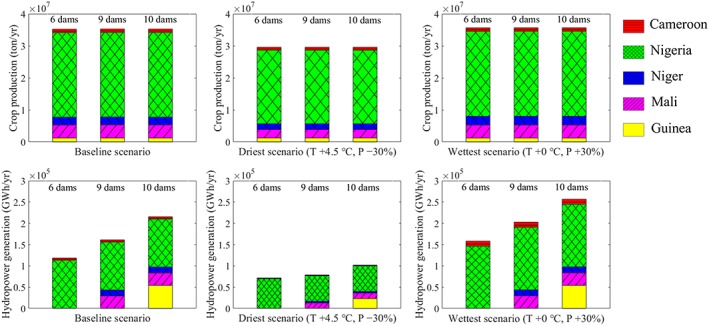
Figure 6.

The joint effect of climate change and water infrastructure development on basin‐wide and national annual irrigated crop production and hydropower generation in the baseline, driest, and wettest scenarios. Abbreviations: T = temperature; P = precipitation.
