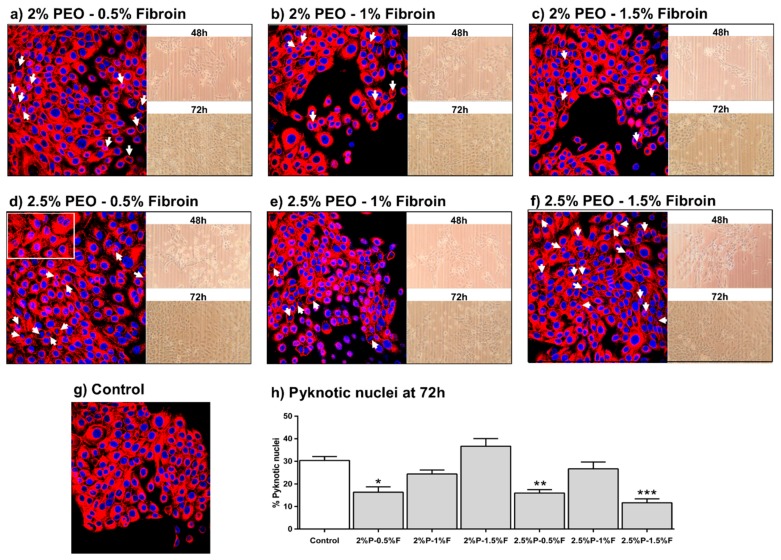
Figure 5.
HaCaT cells seeded on PEO–fibroin electrospun mats after 72 h. (a–f) Fluorescence staining of nucleus (blue), f-actin of cytoskeleton (red), and phase contrast photographs; (h) % pyknotic nuclei quantification at 72 h. Results are expressed as the mean ± standard deviation of triplicates. p-value less than 0.05 (* p < 0.05, ** p < 0.01, and *** p < 0.001) indicates statistically significant difference by one-way ANOVA and Tukey’s test.

