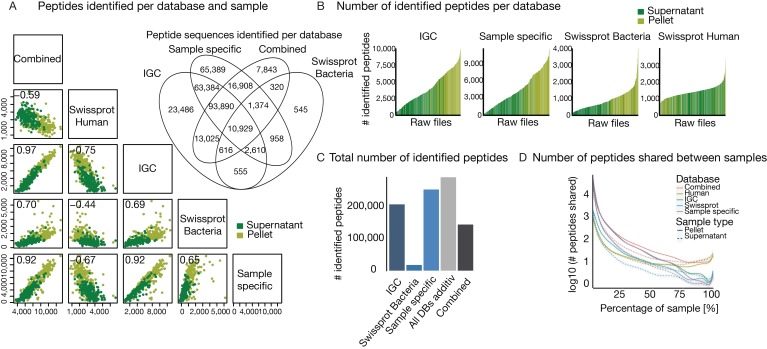
Figure 3.
Comparing the influence of database selection on peptide identification. (A) Multi-scatter plot of identified peptides at 1% PSM and peptide FDR for the four different databases and all databases combined. Identification for pellet and supernatant fraction of each sample is shown separately. Pearson correlation is shown in top left of each box (highest p value is 8.2 × 10⁻²¹). The Venn diagram shows the overlap of identified peptides over all samples for the three bacterial and the combination of all four databases. (B) Histogram of the number of identified peptides of supernatant or pellet for each sample. Raw files are sorted according to the number of identified peptides. (C) Bar plot of the number of total identified peptides over all samples per database. ‘All DBs additive’ shows the theoretical identification by summing up all unique peptides of the three bacterial database types. (D) Polynomial curve fit for the number of shared peptides across all samples for the different databases. Separated for supernatant and pellet fraction of the samples.

