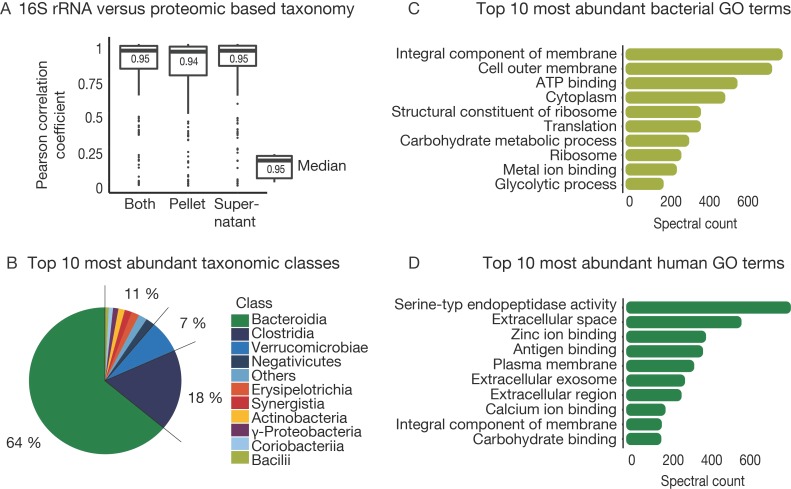
Figure 4.
Description of the taxonomic and functional composition. (A) Box plot of Pearson correlation of taxonomic composition detected at the class level with 16S rRNA sequencing and proteomic analysis for each sample. Both: supernatant and pellet for each sample combined, Supernatant: only the supernatant fraction of each sample, Pellet: only the pellet fraction of each sample. (B) Pie chart shows the most abundant identified taxonomic classes over all samples. (C) Bar plot of average spectral counts for the 10 most abundant bacterial gene ontology (GO) term over all samples. (D) Bar plot of average spectral counts for the 10 most abundant human GO term over all samples.

