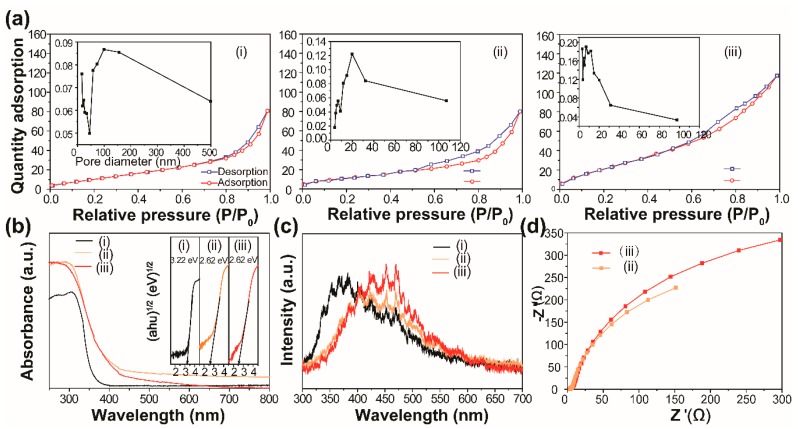
Figure 6.
(a) Brunner−Emmet−Teller (BET) surface area analysis, (b) UV-vis diffuse reflectance spectra and (c) Photoluminescence (PL) of the as-prepared samples: (i) BiOCl, (ii) BiOCl/Bi2WO6 and (iii) Bi2WO6. Insets (a) and (b) are the corresponding pore size distribution and band gap energies of the prepared samples, respectively. (d) The electrochemical impedance spectra (EIS) spectra of (ii) BiOCl/Bi2WO6 and (iii) Bi2WO6.

