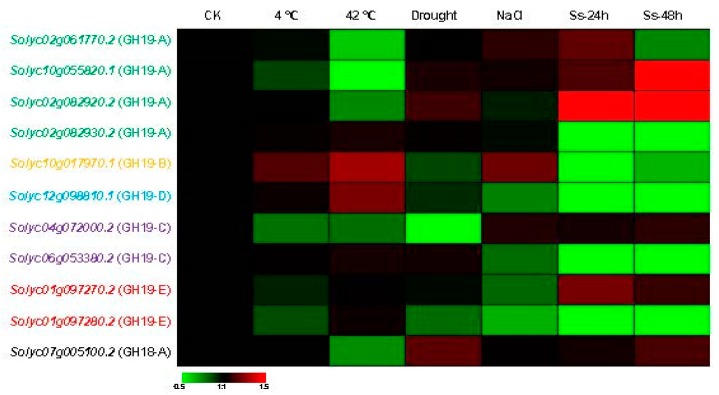
Figure 6.
Expression profiles of the eleven tomato chitinase genes under different biotic and abiotic stresses by qRT-PCR. The fold change between the treated sample and the control sample as the relative expression level. Heat maps reflect the strength of relative expression. Ss stands for S. sclerotiorum. Chitinase genes of different groups are marked with different colors (please refer to Figure 2).

