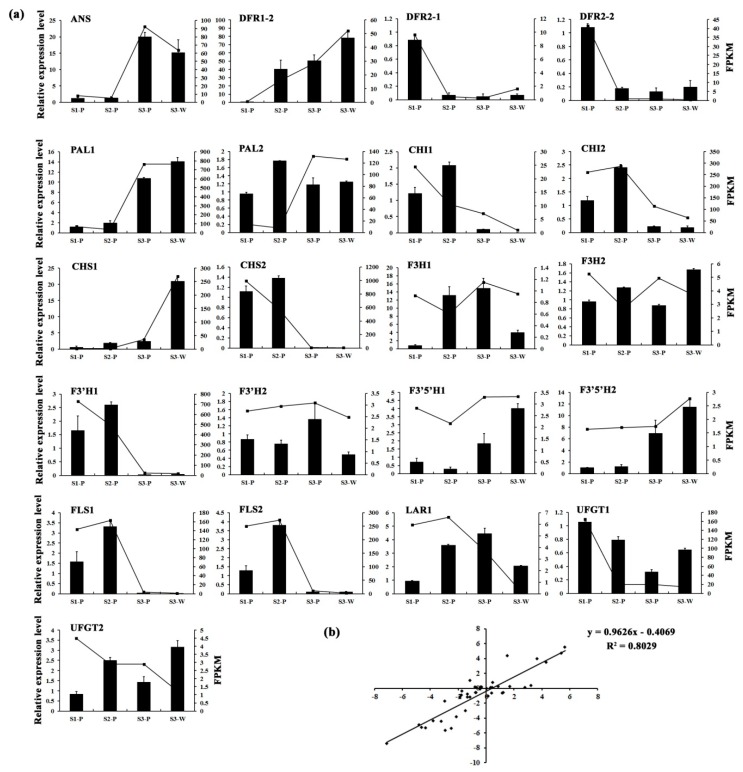
Figure 3.
The qRT-PCR validation of DEGs. (a) The relative expression levels of 21 pigmentation-related candidate unigenes. The left y-axis denotes the relative transcript amount obtained by qRT-PCR. The right y-axis represents the fragments per kilobase per million fragments (FPKM) value of each gene using RNA-Seq analysis. Error bars indicate the standard errors. (b) Correlation analysis of the gene expression value from RNA-Seq and qRT-PCR.

