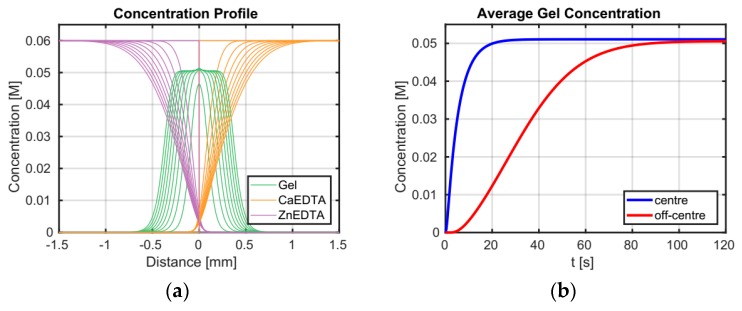
Figure 10.
(a) Calculated concentration profiles for CLEX components and alginate gel at the contact zone plotted every 12 s for the first 120 s of the gel formation process. (b) Evolution of gel concentration at the junction of the two CLEX solutions (region of interest is 50 µm across) and at an off-centre position (offset of 200 μm) to illustrate the difference in the gel formation kinetics due to diffusion of the cross-linking ions at these two locations. The gel concentration is expressed in terms of moles of monomer per litre. Observed concentration profiles are in qualitative agreement with SAXS data obtained at pH 7, where the used model correctly describes the exchange reaction whereby the exchange reaction in complete. At higher pH not all calcium supplied as CaEDTA is released and made available for gel formation.

