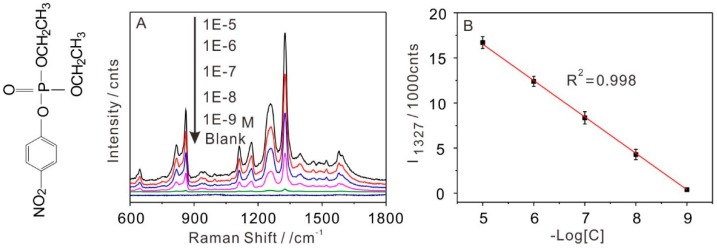
Figure 3.
(A) SERS spectra obtained from different concentrations of paraoxon using self-assembly Au NPs arrays and blank substrate, the left of Figure 3A is the molecular structure of paraoxon; (B) the linear correlation of Raman intensity at 1327 cm−1 with the logarithm of paraoxon concentration.

