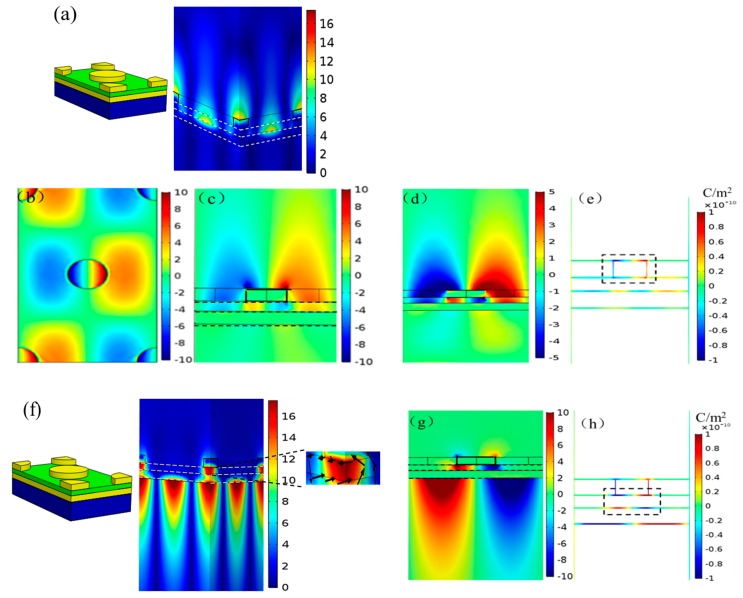
Figure 3.
Electromagnetic field and charge distributions for both plasmon resonances with normal incidence. (a) Normalized magnetic field distribution at 660 nm; (b) normalized electric field distribution for the z component (the most dominant component) at the top surface of the nanodisks at 660 nm; (c) the electric field distribution for the z component in the cross section through the center of the hexagonal nanodisk array for a unit cell at 660 nm; (d) the z component of the electric field distributions taken as a z-axis slice through the center of the hexagonal nanodisk arrays with a shrinking-scale bar at 660 nm; (e) the corresponding charge distribution at 660 nm; (f) normalized magnetic field distribution and its partially enlarged distribution at 946 nm. The black arrows represent the direction and intensity of the electric displacement; (g) the z component of the electric field distribution taken as a z-axis slice through the center of hexagonal nanodisk array at 946 nm; (h) the correspond charge distribution at 946 nm.

