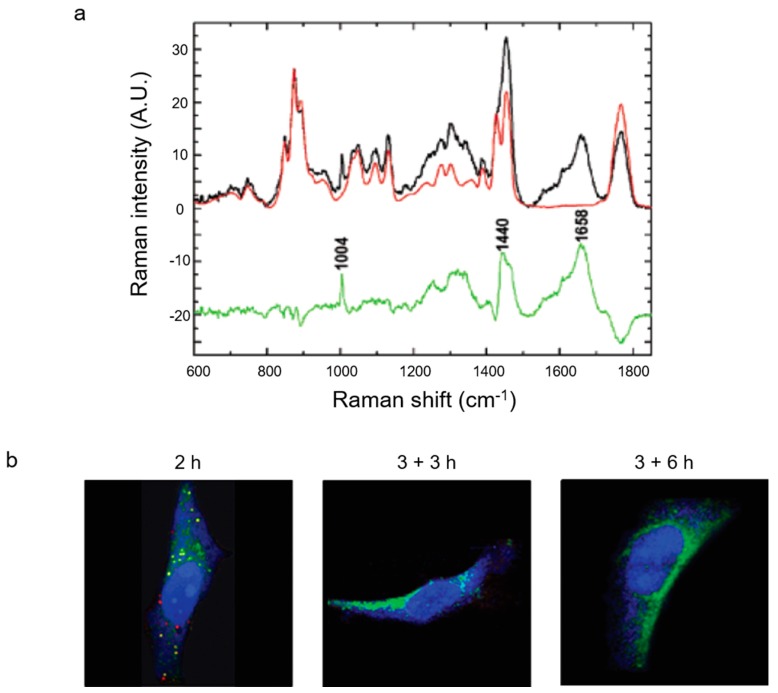
Figure 6.
Imaging nanocarrier behavior over time. (a) The degradation of PLGA nanoparticles in macrophages over two weeks. Red spectrum shows pure, untreated PLGA, black spectrum shows PLGA after two weeks of degradation and the green spectrum shows the difference between the two. Reproduced with permission from [88], Copyright American Chemical Society, 2004. (b) PLGA nanoparticles incubated with HeLa cells showing proteins in blue, lipids in green, and nanoparticles in red. After 2 h of incubation with nanoparticles they were visible by Raman. After 3 h incubation with nanoparticles then 3 or 6 h of incubation with fresh media, nanoparticles were no longer visible. Reproduced with permission from [89], Copyright American Chemical Society, 2009.

