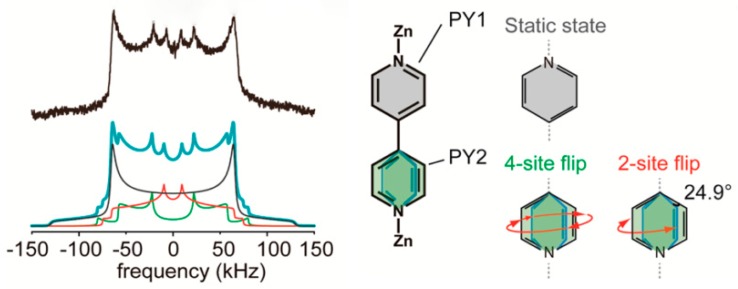
Figure 17.
Experimental (top spectrum) and simulated (bottom spectra) 2H NMR line shapes. The corresponding models for each of the three rotational situations are shown on the right-hand side. Reproduced with permission from [32]. Copyright American Chemical Society, 2015.

