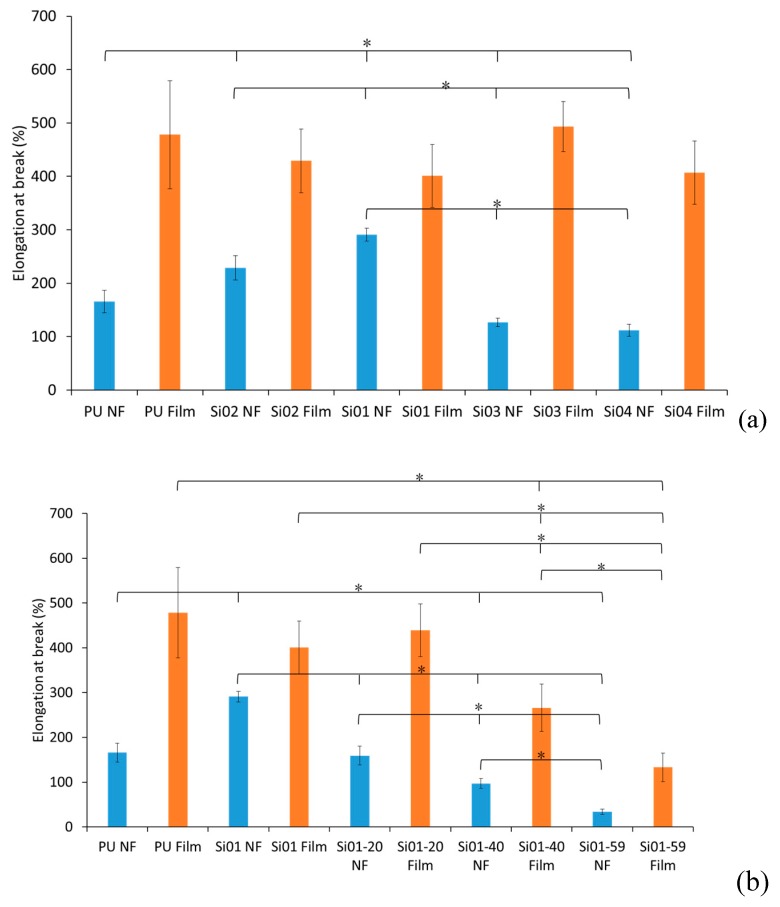
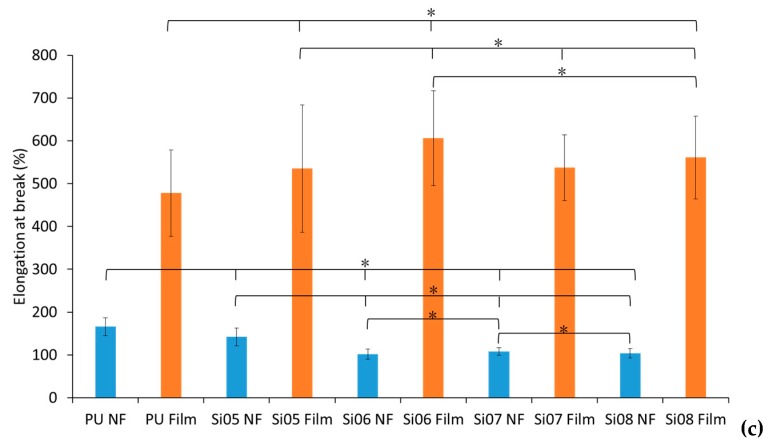
Figure 4.
Comparison of elongation at break (%). “*” was statistically significant (p < 0.05) between each pair of samples. (a) Block-type PUSX nanofibers and films with various chain lengths, (b) Block-type PUSX nanofibers and films with various silicone concentrations, (c) Graft-type PUSX nanofibers and films with various chain lengths.


