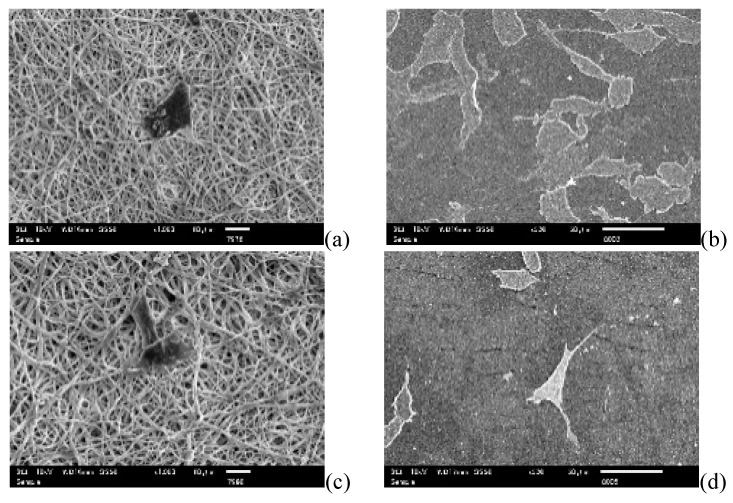
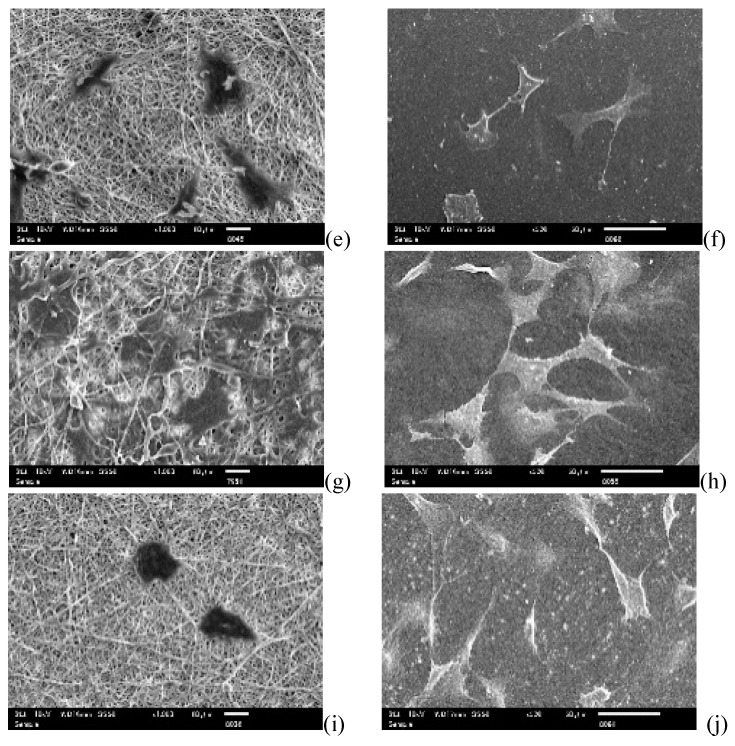
Figure 9.
SEM images of NIH3T3 cells after culturing for three days on each sample. Cell attachment morphologies on PU nanofibers (a) and films (b), Si01 nanofibers (c) and films (d), Si01-59 nanofibers (e) and films (f), Si04 nanofibers (g) and films (h), Si08 nanofibers (i) and films (j). (Magnification of nanofibers 1000×, films: 500×).


