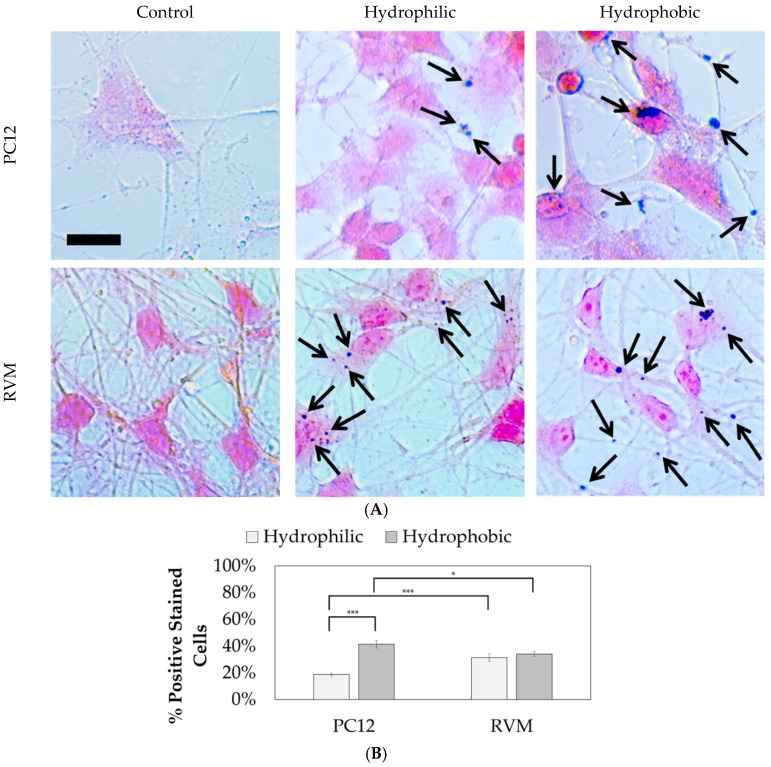
Figure 11.
Brightfield microscopy images of PC12 and RVM cells after 24 h of nanoparticle treatment followed by 7 day differentiation. (A) Prussian blue visualizes the remaining iron oxide and nuclear fast red is used as the counterstain. Black arrows indicate iron oxide particles associated with the cells. Scale bar = 10 µm. (B) Prussian blue positive cell count analysis results. N ≥ 460 cells over 25 images per condition. * p < 0.05, *** p < 0.001.

