Figure 5.

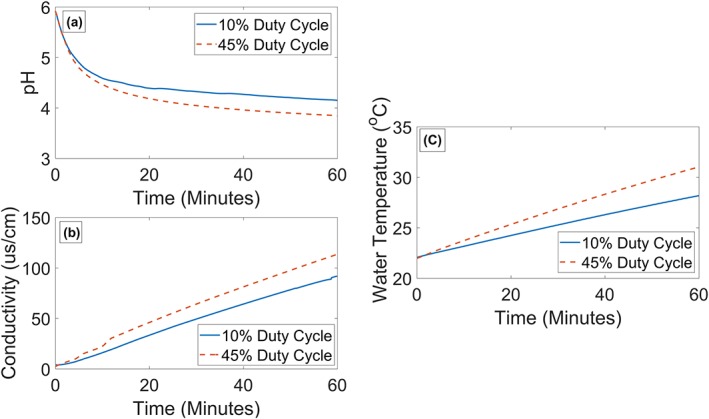
(a) pH (b) conductivity (c) liquid temperature within the pretreatment reactor for 10% and 45% duty cycles.
[Color figure can be viewed at http://wileyonlinelibrary.com]

(a) pH (b) conductivity (c) liquid temperature within the pretreatment reactor for 10% and 45% duty cycles.
[Color figure can be viewed at http://wileyonlinelibrary.com]