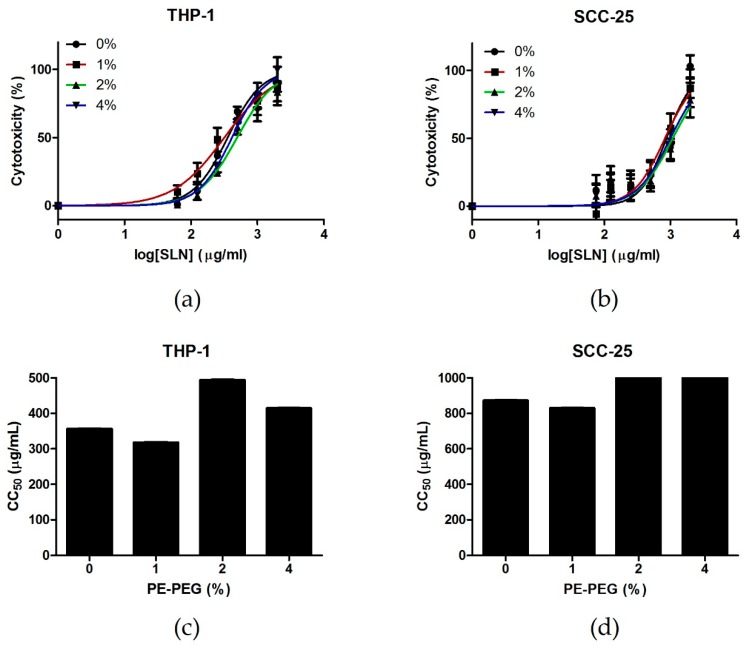
Figure 2.
Cytotoxicity of different SLN suspensions in THP-1 and SCC-25 cell lines. (a) THP-1 cells were seeded into 96-well culture plates at 2 × 10⁴ cells/well. Then, different concentrations of non-coated SLN (0%) (●) or SLN coated with different percentages of PE–PEG (1% (■), 2% (▲) or 4% (▼)) were added to cell culture. They were incubated for 24 h and cell toxicity was determined by CytoTox 96® Non-Radioactive Cytotoxicity Assay. Cell toxicity (%) was defined as mentioned in Materials and Methods. Results are the mean ± SEM of three independent experiments performed in triplicate. Dose-response curves were plotted using GraphPad. (b) SCC-25 cells were seeded into 96-well culture plates at 104 cells/well. The next day, different concentrations of non-coated SLN (0%) (●) or SLN coated with different percentages of PE–PEG (1% (■), 2% (▲) or 4% (▼)) were added to cell culture and cells were further incubated for 24 h. Cell cytotoxicity was determined by CytoTox 96® Non-Radioactive Cytotoxicity Assay. Cell viability (%) was defined as mentioned in Materials and Methods. Results are the mean ± SEM of five independent experiments performed in triplicate. Dose-response curves were plotted using GraphPad. (c) CC50 of different SLN suspensions were obtained from dose-response curves in THP-1 cell culture. (d) CC50 of different SLN suspensions were obtained from dose-response curves in SCC-25 cell culture.

