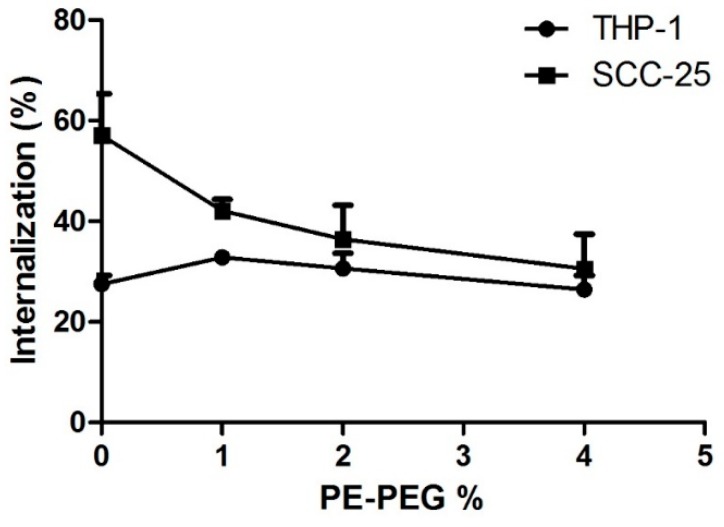
Figure 4.
PEG–SLN internalization in different cell lines with ATP depletion treatment. Cells were pre-incubated for 1 h in the presence of 20 mM of sodium azide and 10 mM of 2-deoxyglucose. Then, indicated SLN suspensions were added and cells were further incubated for 1 h. Then, cells were washed and trypan blue was added in order to measure internalized SLN fluorescence. Data are shown as percentage of fSLN internalization relative to the values of internalization in the absence of sodium azide. Results are the mean ± SEM of five independent experiments.

