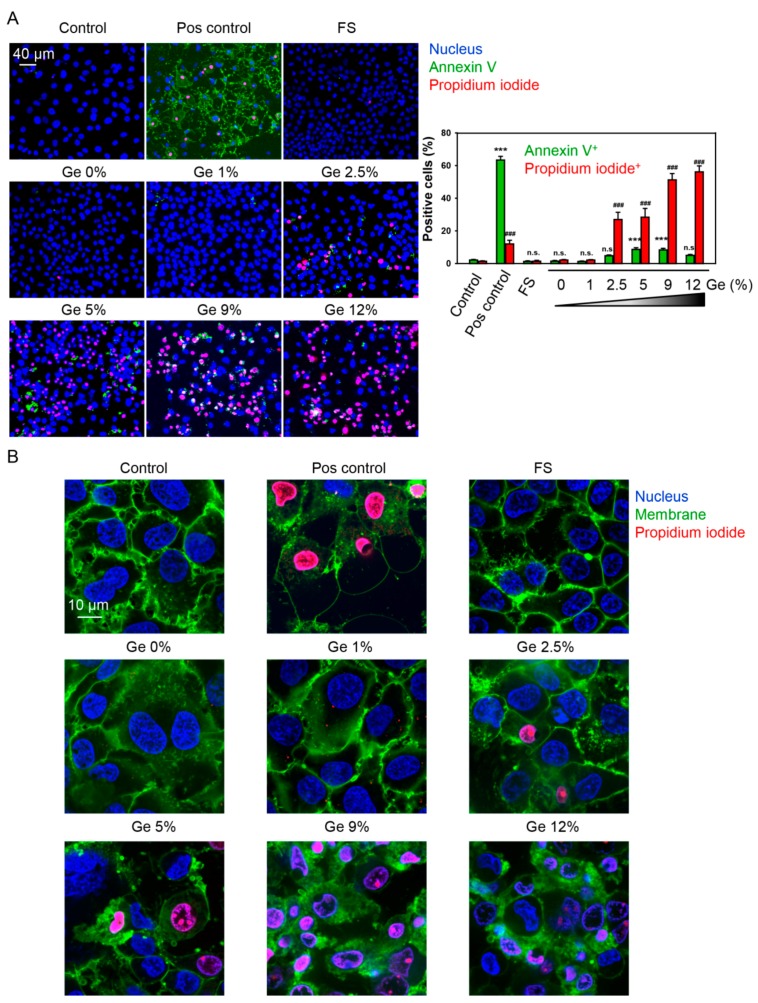
Figure 5.
(A) Analysis of apoptotic cell death. Huh7 were grown on different Ge substrates for 5 days and labeled with annexin V—green dye, propidium iodide—red dye, Hoechst 33,342 nuclear stain—blue. The merging of blue and red gives magenta color. Labeled cells were then imaged using spinning disk confocal microscopy. ImageJ software (NIH) was used for image processing and quantification. One-way ANOVA with Newman–Keuls multiple comparison test was used. Data are expressed as means ± SEM (n = 3), *** p < 0.001. As positive control, 20 µM staurosporine for 2 h was used. (B) Huh7 were grown on different Ge substrates for 5 days and labeled with propidium iodide—red dye, Hoechst 33,342 nuclear stain—blue. The merging of blue and red gives magenta color. Cell membranes were labeled with CellMask™ Green (green). Labeled cells were then imaged using high-resolution spinning disk confocal microscopy. ImageJ software (NIH) was used for image processing. As a positive control, cells were treated with 20% ethanol for 60 min.

