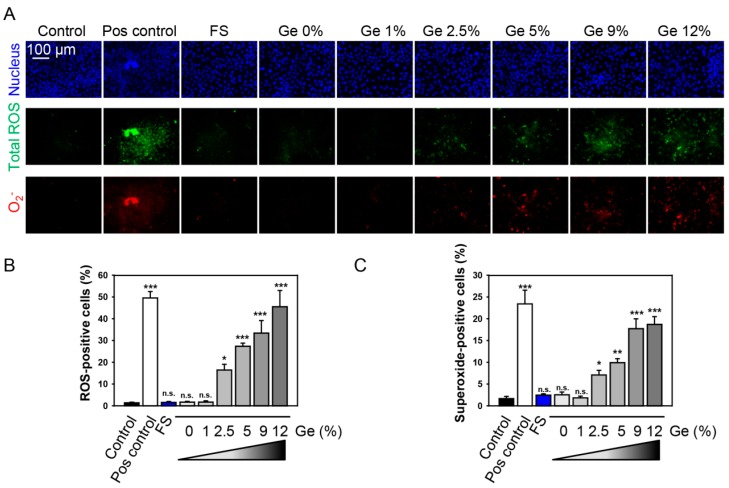
Figure 6.
Cell growth on different Ge substrates results in reactive oxygen species (ROS) accumulation. (A) Cells were cultured on different Ge substrates for 5 days. Cells were labeled with the ROS-sensitive fluorescent dyes using the cellular ROS/superoxide detection kit (Abcam, Cambridge, United Kingdom). Total ROS were labeled with green dye and superoxide anion with red dye. The nuclei were counterstained with Hoechst blue. Cells were imaged using epifluorescent microscope IM-2FL (OPTIKA Italy). Cells treated with H2O2 (1 mM for 30 min) were used as a ROS positive control. Representative images out of three independent experiments are shown. (B) Quantitative analysis of total ROS-positive cells cultured on different Ge substrates for 5 days. ImageJ software (NIH) was used for image processing and quantification. One-way ANOVA with Newman–Keuls multiple comparison test was used. Data are expressed as means ± SEM (n = 3), * p < 0.05 ** p < 0.01 *** p < 0.001. (C) Quantitative analysis of total superoxide-positive cells cultured on different Ge substrates for 5 days. ImageJ software (NIH) was used for image processing and quantification. One-way ANOVA with Newman–Keuls multiple comparison test was used. Data are expressed as means ± SEM (n = 3), * p < 0.05 ** p < 0.01 *** p < 0.001.

