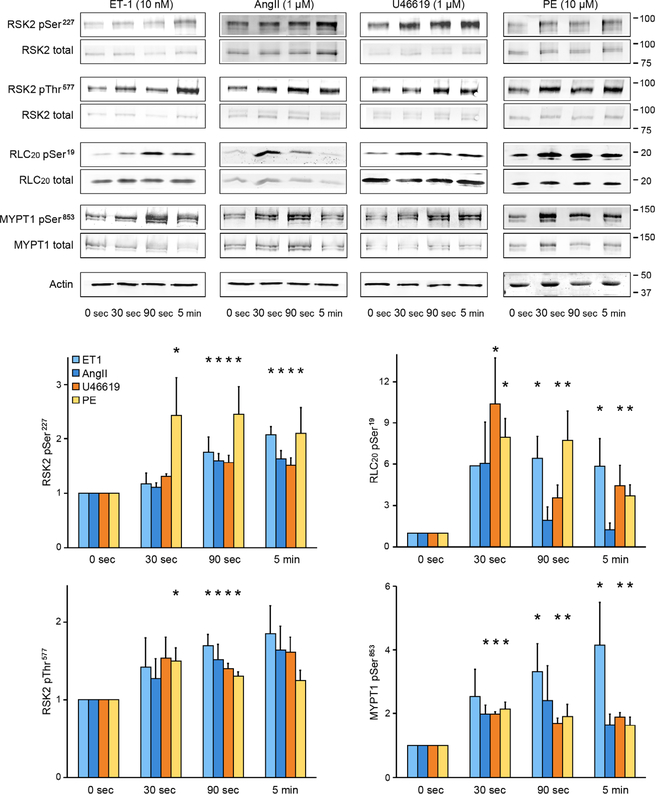
Fig. 3. Western blot analysis for agonist activation of RSK2, RLC20, and MYPT1 phosphorylation in mouse mesenteric artery arcades.
Phosphorylation of Ser227 and Thr577 in RSK2 of Ser19 in RLC20 and Thr853 in MYPT1 (the ROCK site) under resting conditions compared to responses over time to ET-1, AngII, the thromboxane analog U46619, and phenylephrine. The doublets seen for RSK2 and MYPT1 in the Western blots (WB) likely reflect RSK2 isoforms (National Center for Biotechnology Information accession numbers NM 001346675.1 and NM 148925.2) and the two MYPT1 isoforms. Data are means ± SEM; n = 3 mice per agonist group and 3 artery samples per time point. *P < 0.05 for each time point compared to the corresponding control (0 s) for each agonist. P values were determined by two-tailed homoscedastic Student’s t test.

