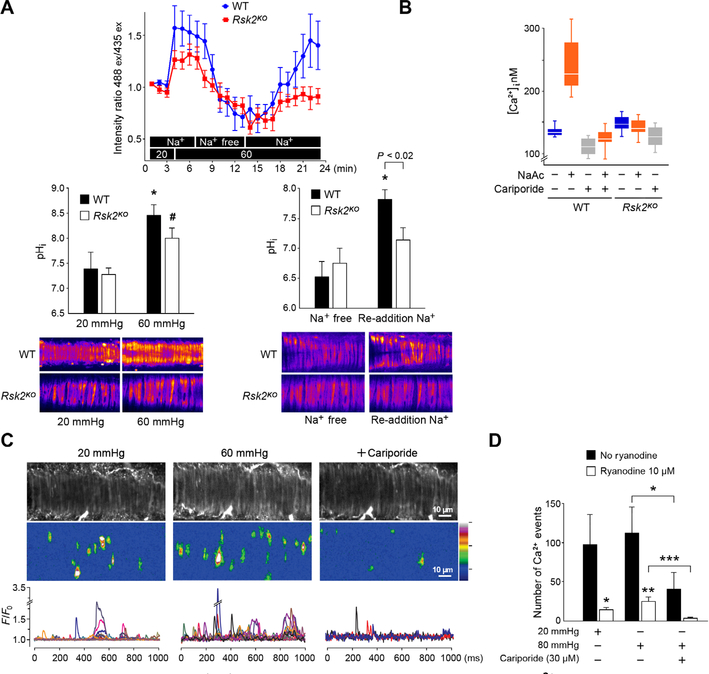
Fig. 6. RSK2 activation of the Na+/H+ exchanger increases intracellular pH and Ca2+.
(A) RSK2-regulated NHE-1 activity was monitored with the ratiometric fluorescent pH indicator BCECF-AM loaded into WT and Rsk2KO mesenteric arteries. Bar graphs show conversion of intensity ratios to pH with typical fluorescent images of arteries. n = 3 mice per genotype and 6 arteries. *P < 0.05, for 20-mmHg pressure compared to 60-mmHg pressure and for Na+-free compared to re-addition of Na+ for WT arteries; #P < 0.02, for 20 mmHg compared to 60 mmHg in Rsk2KO arteries, two-tailed homoscedastic Student’s t test. The last three pH values for WT and Rsk2KO arteries upon re-addition of Na+ are averaged in the bar graph. (B) Cytosolic Ca2+ measured in WT and Rsk2KO aortic smooth muscle cells treated with sodium acetate (NaAc) to stimulate NHE-1, with or without the NHE-1 inhibitor cariporide. n = 3 biological replicates per genotype. P < 0.0002 for [Ca2+] in WT cells before and after treatment with NaAc, two-tailed homoscedastic Student’s t test. (C) Typical example of Ca2+ transient analysis in WT mesenteric arteries in the presence of 10 μM ryanodine to block Ca2+ release from the ryanodine-sensitive Ca2+ stores. Gray-scale images showing smooth muscle cells in an artery. Typical Ca2+ fluorescent intensity images of all the event sites in the field summed over 1000 ms. F/F0 traces of cytoplasmic Ca2+ transients. Each color represents a trace from a region in a different cell. (D) Summary of Ca2+ events at 20- and 60-mmHg intraluminal pressure in the presence and absence of cariporide and/or ryanodine. Data are means ± SEM. *P < 0.05, ***P < 0.001, n = 4 mice and 6 arteries without ryanodine. *P < 0.05, **P < 0.01, n = 4 mice and 6 arteries with ryanodine treatment.

