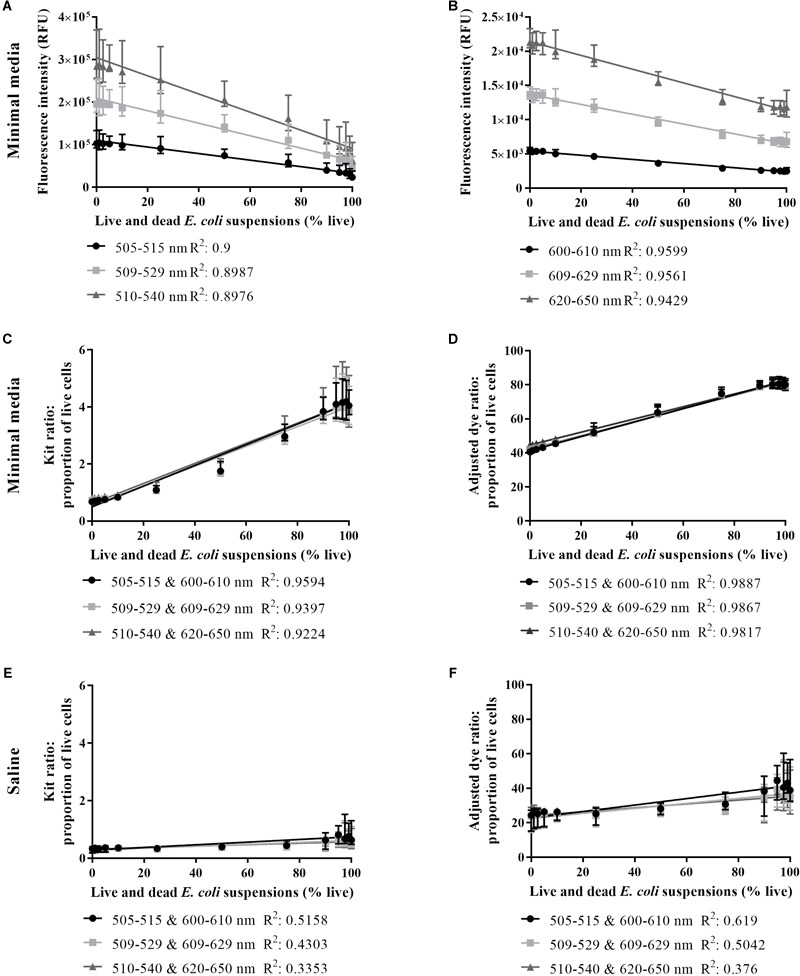
FIGURE 2.

Live/dead spectrometry on live and dead E. coli suspensions in minimal media and saline. SYTO 9 intensity in minimal media (A), PI intensity in minimal media (B), proportion of live cells in minimal media derived from the kit ratio (C), % live cells in minimal media derived from the adjusted dye ratio (D), the proportion of live cells in saline derived from the kit ratio (E) and % live cells in saline derived from the adjusted dye ratio (F) for live and dead E. coli suspensions derived from integrating at three different wavelength ranges for each dye. An R2-value was generated from a linear regression analysis of data from each wavelength range. Data presented is the median with the range from six biological replicates.
